A brand new map reveals what Antarctica is like below the two,000 meters of ice that covers it | Science | EUROtoday
The floor of Mars was photographed by the probe Mars Global Surveyor between 1996 and 2001. All its valleys and mountains are identified with a spatial decision of as much as 50 meters. That of Venus was mapped by Magellan already in 1989. The maps obtained present particulars as much as 100 meters. Images of Mercury captured by the spacecraft Messenger Since 2011 they’ve achieved resolutions of as much as 665 meters. However, right here on Earth, the decision of the maps of the rocky floor of Antarctica doesn’t go beneath 50 kilometers. The fault? A layer of hundreds of meters of ice that blurs the Antarctic contours. Now, a piece revealed within the journal Science It reveals what the Antarctic continent is like due to the roughness of the outside of the frozen layer that hides it.
Antarctica, with its 13.6 million sq. kilometers of extension, is nearly 28 instances bigger than Spain and 7 instances bigger than Mexico. But 99% of the continent is completely coated in ice and it isn’t small: 27.17 million cubic kilometers, in accordance with Bedmap3, the penultimate map, the one promoted by the Scientific Committee for Antarctic Research (SCAR, for its acronym in English). A cubic kilometer of ice is 1,000 meters lengthy by 1,000 meters large and one other 1,000 meters excessive, and thus, 27.17 million instances. That’s why it is not straightforward to know what the land beneath is like.
“We see a relationship between the characteristics of the landscape under the ice and the undulations of its surface,” says Helen Ockenden, first creator of the research and a glaciologist on the Edinburgh Cryosphere, an institute on the college of the Scottish metropolis. “The mathematics describing this relationship has been well known since the 1960s, but now we can combine it with modern satellite observations of the ice surface and use them to map the landscape under the ice,” provides Ockenden. “It’s like sailing in a canoe and finding rocks hidden under the surface of the water, but these rocks produce eddies that help locate them. Ice is much more viscous than water and flows very differently, but we can use the characteristics of the ice surface to identify hidden hills and valleys,” compares the researcher on the University of Grenoble Alpes, in France.
The first maps of bedrock started within the Fifties. They first achieved them by detonating explosives in holes within the frozen layer and measuring with seismographs the time it took for the echo of the explosion to bounce again and the form of the wave. With radars, notably airborne ones, they grew to become extra refined. But there was solely dependable knowledge on the strips – the routes – over which they flew. For the remainder of the territory, the out there info from the detected topography is extrapolated to the shadow areas. In 2025, Bedmap3, the map powered by SCAR, gathered all the information obtained because the Nineteen Sixties, enhanced with 82 million new reference factors. The revealed methodology now illuminates the shadows that remained: with high-resolution pictures of the frozen layer supplied by present satellites, they deduce what the land on which it rests is like.
It is as if the orography of the Antarctic ice had been a mirror picture of the underside on which it sits. The common thickness of the frozen layer is 1,948 meters, a determine that rises to 2,148 meters if the big ice cabinets floating on the ocean are excluded. But the common hides huge oscillations, from a number of meters within the areas closest to the coast of the Antarctic Peninsula, within the west, to the top of the frozen layer, which rises to 4,757 meters, a plateau nearly as excessive as Mont Blanc, in a big space of Wilkes Land, in East Antarctica.
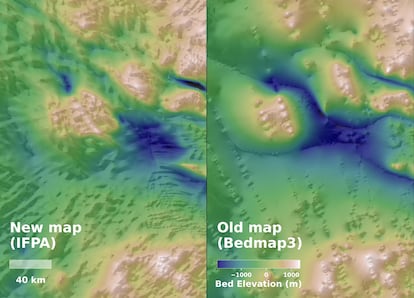
“Let’s imagine that the Pyrenees were covered by a layer of ice two kilometers thick and that the only way to try to understand the shape of the mountains below was to make some profiles from the air, but that they were separated by about 10 kilometers and then we tried to interpolate the shape of all the mountains,” says glaciologist Robert Bingham, professor on the Edinburgh Cryosphere and senior creator of the analysis. “Simply, we would not see the entire landscape, but rather something much more uniform between the points with data obtained from the 2D paths,” provides the researcher. “However, if we applied our method, most likely the surface of that ice sheet over the Pyrenees (as we see today in Antarctica) would contain very subtle hills and depressions, perhaps with only a few meters of difference in elevation, but enough for this information to allow us to obtain a much more precise estimate of the appearance of the mountains below,” he completes.
The new work doesn’t uncover new mountain ranges or massive lakes below the ice like these unearthed by Bedmap3. It was already identified that below the ice there isn’t any uniform continent. In truth, if the frozen layer had been to soften, along with elevating the ocean degree of all the planet by about 57 meters, it will reveal an emerged half within the japanese portion of the continent, however an archipelago of huge islands within the western half, as a result of a very good a part of it’s beneath sea degree. It would not appear seemingly that people will ever see it. Even on the present price of warming, it will take a whole lot of hundreds of years, maybe thousands and thousands, for Antarctica to be freed from the ice that started to cover it 34 million years in the past.
“Our method complements Bedmap: what we have provided is a more precise view of the shape of the landscape between the points where there are radar traces in Antarctica,” highlights Bingham, who’s a part of the worldwide consortium of Antarctic scientists. However, his Spanish colleague Jerónimo López goes a little bit additional. “The new method combines the available measurements of ice thickness with the interpretation of the physics of glacial flow and its surface features, revealed by the recent existing high-resolution observations, to identify in more detail the topography existing under the ice,” says López, a professor on the Autonomous University of Madrid who was president of SCAR till 2016.
Both López, who was not concerned on this research, and Bingham, considered one of its authors, spotlight the significance of understanding what Antarctica is admittedly like below the ice. “Knowing the topography hidden under the Antarctic ice helps to understand the interaction between the ice and the bedrock and what Antarctica’s response to warming may be like,” says López. “At the most basic, but crucial, level, the shape of the surface over which the ice flows defines the friction that this ice flow faces, which in turn affects how quickly it will flow into the sea, melt, and therefore contribute to sea level rise,” Bingham remembers.
All in all, this is not going to be the final map of Antarctica. The enchancment is targeting the so-called mesoscale, with resolutions between 2 and 30 kilometers. “The ice interacts with the bedrock at various scales, not just the mesoscale,” remembers Duncan A. Young, a researcher on the Institute of Geophysics on the University of Texas (United States) in an e-mail. “If we consider this on a human scale, with this map we could see the characteristics of the cities, but not the neighborhoods,” compares Young, who has revealed a touch upon this new methodology, additionally revealed in Science. Young trusts that, with strategies just like the one now offered, an much more full map can be obtained for the following International Polar Year, 2032-2033.
https://elpais.com/ciencia/2026-01-15/un-nuevo-mapa-muestra-como-es-la-antartida-bajo-los-2000-metros-de-hielo-que-la-cubren.html